Sunday, March 19, 2023
Cost of Living Index by US States: Dynamic Visualization
Wednesday, March 15, 2023
My Journey to Win Mega Millions (I didn't win yet)
This is a video for my journey to win mega millions using my Mega Million Winning Number Generator on Github.
*** features light background music.
Sunday, March 12, 2023
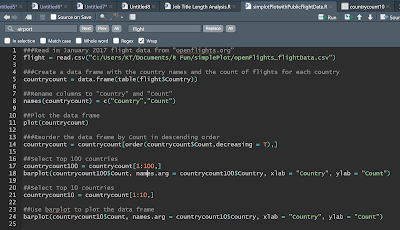
Creating Powerful Visualizations with R - Only 9 Lines of Code
I downloaded international flight data from Openflight.org for January 2017 and created compelling visualizations based on the flight frequency by country using only 9 lines of R code. My goal was to achieve both effectiveness and efficiency in my visualizations.
Raw Data (https://raw.githubusercontent.com/jpatokal/openflights/master/data/airports.dat)
Saturday, March 11, 2023
Creating a Dynamic Visual Experience
Friday, March 10, 2023
Effective Visual Highlighting
Thursday, March 9, 2023
Example of My Approach to Highlighting the Importance of Data Quality
Tuesday, March 7, 2023
My YoY CPI Meter
I created a meter visual for the YoY CPI change based on the historical year-over-year (YoY) Consumer Price Index (CPI) measures from 2013-01-01 to 2019-12-31 (Approx. Pre COVID-19 in the US).
https://www.bls.gov/regions/mid-atlantic/data/consumerpriceindexhistorical_us_table.htm
Monday, March 6, 2023
Brian Lee's Video Intro - Apr. 2023
** features light background music
-
Utilizing Personal Projects to Highlight the Importance of Data Quality in Business - A Practical Example. ** The cover page of the newslett...
-
I downloaded international flight data from Openflight.org for January 2017 and created compelling visualizations based on the flight freque...
-
I created a meter visual for the YoY CPI change based on the historical year-over-year (YoY) Consumer Price Index (CPI) measures from 2013-0...


